Russia World Cup 2018. Attack Finishing Stats by Continent.
Examining the match statistics of teams competing in the current World Cup shows some interesting differences as regards the continents. These differences show why some continents are more likely to produce a World Cup winner than others.
The stats shown in tabular form in this post examine the best 3 teams from Europe, South America, Africa, Asia and Concacaf in the 2018 World Cup group stages. The standard this soccer blog uses in determining these teams is points gathered in the group stages, goals difference and group standings.
Teams considered:
Europe
Belgium - 9 Points
Croatia - 9 Points
France - 7 Points
South America
Uruguay - 9 Points
Brazil - 7 Points
Colombia - 6 Points
Africa
Senegal - 4 Points
Nigeria - 3 Points (-1 GD)
Tunisia -3 Points (-3 GD)
Asia
Japan - 4 Points (0 GD, 2nd position)
Iran - 4 Points (0 GD, 3rd position) )
South Korea -3 Points (0 GD)
Concacaf*
Mexico
Costa Rica
Panama
* To speak of the best 3 teams in Russia 2018 from this region may seem controversial because it only produced 3 teams altogether for the tournament. But the nature of their qualification format suggests these were certainly the best 3 teams from the Concacaf region!
The finishing stats are derived by dividing the total number of goals scored by each team by the total number of shots achieved by each team in all their 3 groups matches. Shots on target are not considered because it can be a deceptive statistic if the opposing goalkeeper in a match caught all shots on target comfortably!
When we get the goals - to -shots (GTS) ratio for each considered team in a continent (Top 3), we then calculate the average GTS ratio for that continent to reflect that continent's finishing prowess in soccer.
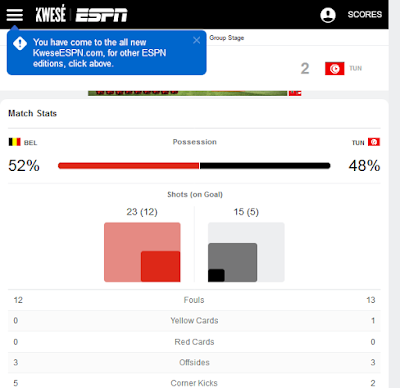
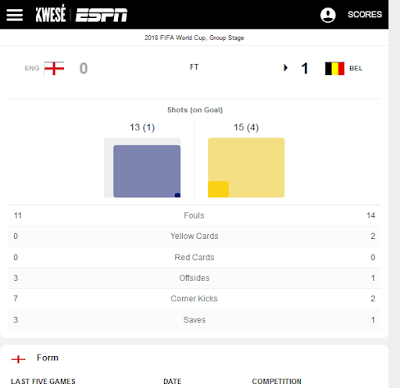
For instance, Belgium's GTS can be acquired from the following stats which are available via the espn website. Image Screenshots follow.
We can see from the espn stats that Belgium had a total of 53 shots in the group stages and scored 9 goals from these shots making a relatively high GTS ratio of 16.98%
The Top 3 GTS Ratio for all the continentwith teams at Russia 2018 is as tabulated below in descending order.
CONTINENT
|
TOP
3 GOALS TO SHOTS RATIO
|
Europe
|
14.42%
|
South America
|
13.43%
|
Africa
|
11.79%
|
Asia
|
10.50%
|
Concacaf
|
7.55%
|
What this clearly shows is that top European teams are significantly ahead of top teams from other continents in the business of converting scoring opportunities, and this may explain why Europe has dominated the World Cup for the last decade or more!


Social Plugin